small logo SETI League Photo Gallery

Project Argus: What We've Heard So Far
link to Project ARGUS

(Click on thumbnail to download full picture)

Caution: be advised that these tend to be large files. Importing them will consume considerable Web bandwidth and connect time.

Attn. Journalists and Photo Editors: please check our Fair Use Policy before reproducing any of these images. Thank you.

Since the launch of The SETI League's Project Argus sky survey in April 1996, our members have detected a few interesting signals. They are depicted here, along with noteworthy results of some prior SETI experiments.

See Also:

Many Project Argus participants use software that performs a Fast Fourier Transform on the audio output of their receivers, presenting the result as a waterfall display. Longtime Argonaut Peter Cheasley goes one step further. He uses a music program called Widi to simultaneously convert the audio components in the waterfall to a musical score, displaying them as notes on a staff. This unconventional display allows those trained in music to perform comparative analysis of the audio components being received, hopefully highlighting non-natural phenomena for further analysis.
VE2TPR image
thumbnail

Argonaut Peter Cheasley, VE2TPR, sends along this 3.5 GHz detection from 25 October 2011. The diagonal lines in the spectrogram are a signal which is highly Doppler shifted, hence emanating from beyond Earth. The short horizontal signal segment highlighted with the arrow is stable in frequency, hence obviously terrestrial interference. It is not often that a Project Argus station can capture a candidate extraterrestrial signal, and a terrestrial one, in the same image. This picture illustrates most eloquently how easily the wetware between your ears can distinguish between the two.
VE2TPR image
thumbnail

This waterfall display produced by Peter Cheasley, VE2TPR, on 7 January 2011 at 3.5 GHz, shows a highly coherent (narrow-band) signal with a Doppler curve typical of a low Earth orbit (LEO) satellite. Such signals frequently plague Project Argus observers, because they are clearly of non-natural origin, but generally produced by human technology.
VE2TPR image
thumbnail

The HF Active Auroral Research Program (HAARP) studies ionospheric physics from a high-power transmitting facility in Alaska. The HF transmitter consists of 180 antenna elements having a net radiated power capability of 3.6 MegaWatts. In January 2008, Ed Cole, KL7UW, was among five SETI League members who recovered HAARP signals reflected not off the ionosphere, but rather off the lunar surface. Both the direct (strong) and EME (weak) signals can be seen in this waterfall display.
KL7UW image
thumbnail

David Ocame, WS1ETI, shares this calibration sweep of the sun with the Universal Software Radio Peripheral (USRP) receiver. He writes, "by parking the 8 ft dish just above the Sun's position, I let the Sun come up until it was centered, and then let it keep going. It took 1.5 weeks to do this. The day with the highest deflection on continuum trace was calibrated using data from the Learmonth Observatory. Learmonth reports in solar flux units (SFU). 1sfu=10000Jy. Compared to my best trace from last year using the good old Icom r7000, with a BW= ~3500Hz and adjusting for variation in the Sun's output I've determined that using the USRP with a BW of 4MHz gives me ~384% increase over the narrower bandwidth."
WS1ETI image
thumbnail

James Van Prooyen, N8PQK, observed the NASA Stardust spacecraft's re-entry into the Earth's atmosphere on 15 January 2006. This observation was done with a Radio Astronomy Supplies 40 kHz VLF receiver in Grand Rapids, Michigan. Jim writes, "I have observed several other such event on VLF, such as space shuttle launches."
N8PQK image
thumbnail

1415 MHz lunar transit in a total power radiometer, as observed by Dave Ocame, N1YVV. Dave writes, "I arrived home to the happy coincidence of the moon sliding through the beam of my dish. It's maybe not the smoothest trace and there is a 'drop out' that occurs just after the signal reached it fullest. These drop outs have been plaguing me for a while now and I believe them to be de-sensing caused by local airport radar. An unfortunate consequence of using such a wide bandwidth."
N1YVV image
thumbnail

Marcus, VE3MDL, sends along this solar transit plot. He writes, "It looks pretty, but it's about 8 minutes late due to RA alignment errors. Also, I was doing this to measure 'Y' factor, and I think that I'm "missing" about 2.5-3dB. I measured about 8.8dB 'Y' factor during the Sun transit. That may partially be due to alignment error--perhaps 0.5dB, but also, moving the bandpass filter in between the 1st and 2nd LNAs will have caused the Tsys to jump from about 80K to around 160K or so."
VE3MDL image
thumbnail

Marcus Leech passes along this total-power meridian transit of Sagittarius A. Marcus writes, "There's lumpiness due both to receiving system instability, and the fact that the galactic background radiation is not uniformly distributed in intensity. Around 16:20 or so, there's some interference from the Sun, since it transited only 2 beam-widths above where I was pointing. The quasi-discrete source at the galactic center is driven by a postulated black hole. The physics are complicated, but part of the emission is thermal, due to heating of the surrounding gas and dust by gamma and x-rays coming out of the event horizon around the black hole as matter falls into it."
VE3MDL image
thumbnail

First light with a USRP! David Ocame sends this hydrogen line sweep, made in August, 2006 with his new Universal Software Radio Peripheral, at the Stony Creek Observatory, ARGUS station FN31og. He says, "the HI 'bump' is clearly visible. The present screenshot was taken with parameters set at 2MHz BW." Dave credits Marcus Leech, VE3MDL, with "a LOT of hand holding to get me to this point."
N1YVV image
thumbnail

VE3MDL got an improved 1420 MHz sun sweep with his small (1.36 meter) dish in late April, 2006. Marcus writes, "Moving from fractional dB to a linear RMS millivolts measure seems to have improved things, as has moving to a different final integrating filter prior to data recording and real-time plotting. The Tant shown is based on a single calibration point using a feed-aperture-filling container of warm water at about 310K. If you backtrack the given Tant (about 405K for the solar peak), and multiply it by the solar-to-dish-beam area ratio, it gives roughly 133,000K for the observed solar blackbody temperature at 21cm. Your mileage may vary."
VE3MDL image
thumbnail

This hydrogen-line sweep of the Galactic Centre by Marcus Leach, VE3MDL, was made in early 2006. Note the double bump in amplitude, representative of two distinct relative velocities, as Hydrogen clouds drift around in the interstellar medium.
VE3MDL image
thumbnail

Rick Bishop recovered this signal, about 4 dB out of the noise, at ARGUS station FN54gj on 5 April 2006. His station was monitoring RA 8.46, Dec +42.61, at 1418.497 MHz. Since the trace in the waterfall dispay is perfectly vertical (indicative of zero Doppler shift), the signal was most likely terrestrial interference.
Rick Bishop image
thumbnail

Argonaut Marcus Leach, VE3MDL, has written a pulsar detection module for use with the Universal Software Radio Peripheral (USRP). He writes, "Here's a screenshot of my pulsar application, looking at a simulated pulsar. My calibration source being on-off modulated by the audio port on my computer. I set the modulator to 23.25Hz for this particular experiment. The post-detector spectrum shown is a little bit different from a normal pulsar -- the fundamental tends to be smaller than some of the harmonics, due to the short duty cycle of the pulses. My "test" pulsar on the audio port has a 50% duty cycle."
VE3MDL image
thumbnail

Argonaut Marcus Leach, VE3MDL, made this 1420 MHz sun sweep with a 2.5 meter diameter test dish, fed by a cylindrical waveguide horn. His receiver is the Universal Software Radio Peripheral (USRP) produced by Ettus Research. His open source DSP software is part of the GnuRadio project.
VE3MDL image
thumbnail

Another USRP observation by Marcus Leach, this time of a Doppler shifted hydrogen-line bump in the Galactic continuum. He writes, "my aperture is almost identical to the aperture of the feedhorn they used to make the very earliest HI observations, so in theory, I should be able to observe the spectral signature."
VE3MDL image
thumbnail

thumbnail
In Spain, Iban Cardona has demonstrated the advantages of using a broadband detector for SETI spectral analysis. At left is a GPS satellite signal, viewed on his Icom receiver using its standard SSB detector. At right, the same signal is downconverted to baseband with an external product detector, tapped into the receiver's IF. The result is six times the spectral coverage.
EB3FRN images
thumbnail

Project Argus Station FN54gj is on the air! For First Light on 1 September 2005, Rick Bishop did this hydrogen line drift-scan sweep around Decl. +44 degrees, RA 22 hours, with a 12-foot dish and SDR14 software defined receiver.
Rick Bishop image
thumbnail

At Project Argus Station JO89sn near Stockholm, Greger Gimseus has managed to image the Sun at 1720 MHz, using a modest 1.8 meter parabolic antenna. Greg plans to upgrade his station to 1420 MHz, using a recently acquired 3 meter dish.
Greg Gimseus image
thumbnail

Harry Kimball has detected his first instance of a signal that could not immediately be discounted as terrestrial interference. He writes, "the signal occurred on 12/29/2004 centered at approximately 00:43 UT, which puts it at about RA 0 hr 53 min and dec +30. It is contained in 4 files which each hold 2 minutes and 52 seconds of data, however, the timestamps on the files show that one of them was written to continuously and the other three were written to over a longer period indicating that the signal fell below the 'write to file' threshold on the software (SpectraVue). Consequently, the duration of the signal may range from about 20 to 40 minutes start to finish. My 3 dB beamwidth is about 19 minutes at this declination. The signal was at about 1420.053 MHz and drifted down in frequency, at varying rates, while being observed. The df/dt ranged from as low as 0.05 Hz/s to about 0.38 Hz/s. I would expect to see about 0.11 Hz/s due to the rotation of the Earth at this declination (I have a fixed azimuth at ~180 deg). I have been observing this declination and frequency for quite some time and have not seen a signal like this." Follow-up observations by other Argonauts are hereby solicited.
N0TOU image
thumbnail

G4PMK has been observing this strange, intermittent signal at his Project Argus station IO91ip. Roger writes, "These signals may appear for up to 20 minutes or so, up to several times a day, but a week or more may pass without getting any. They bear absolutely no relationship whatever to local or siderial time. What is characteristic is when put on the doppler display on SETIFOX, there are two peaks either side of the central one, at + - 22Hz, and these broad sidebands consist of a number of peaks. Experiment has established that they are coming in via the dish system and not from the IF or receiver electronics." Computer interference is suspected.
G4PMK image
thumbnail

thumbnail
Sun transit images before (left) and after (right) N1YVV made major upgrades to his Project Argus station. Dave's improvements include changing the antenna feed on his eight foot dish from a 3-turn helix to a cylindrical waveguide horn, replacing his Icom PRC-100 receiver with an Icom IC-R7000, disabling receiver AGC, and thermally stabilizing his downconverter crystal by adding a positive temperature coefficient thermistor. Sun noise now peaks at 7.44 dB, for a system G/T of 7 dB.
N1YVV images
thumbnail

S57UUU passes along the first fringes from the Sun, received on his SIDI interferometer. Marko writes, "In the last few months I have been working on a simple digital interferometer (SIDI for short) as a step towards the ERAC's ALLBIN project. It uses direct conversion receivers and single bit sampling. By truly digital I mean digital in the strong sense - that is sampling of individual channels and all further processing in the digital domain, as oposed to just A/D converting fringes produced with analog circuitry."
S57UUU image
thumbnail

Tom Hutter captured this interesting example of bistatic radar while monitoring the uplink of the W2ETI Moonbounce Beacon, transmitting from just a few km away. The vertical line is the beacon (you can see the steady carrier, and the Morse Code identifier starting at the very bottom of the trace). The diagonal lines (one straight, the other curved) are reflections of the beacon off the skin of aircraft passing overhead. The Doppler shift of the signals (indicated by the slope of the lines) is an indication of the velocity of the reflecting aircraft. The curved radar return is an indication of the aircraft changing relative velocity (either by speeding up and slowing down, or by following a curved flight path). Tom writes of the second aircraft, "The craft was so low, I could here the pitch of the engine and the pitch of the signal from the receiver simultaneously. They were both resonating at the same frequency as it passed. (Had an eerie stereo effect.)"
Tom Hutter image
thumbnail

Peter Cheasley, VE2TPR, is busy doing digital audio processing on decametric wave bursts received from Jupiter. Here is the time-domain display of one such burst.
VE2TPR image
thumbnail

Second Jupiter burst signal processed by VE2TPR. This one is a spectrogram of the signal depicted in time domain, above.
VE2TPR image
thumbnail

Third Jupiter burst signal processed by VE2TPR. This final image is a waterfall display of the signal depicted in time and frequency domains, above. These types of analyses help Project Argus participants to perfect their software and techniques.
VE2TPR image
thumbnail

First light at VE3MDL: Argonaut Marcus Leech made this sun transit image in Ontario, Canada, with a 1.5 meter dish at 11.9 GHz, in November of 2002. He writes, "The receiving setup was mostly homebrew, and quite unsophisticated. A commercial Ku-band LNBF, a couple of line amplifiers, a dielectric filter (free sample!) with a bandwidth of 50Mhz, a zero-bias Schottky detector (HSMS-2852--thanks to Agilent for another free sample), and a conventional DC-amplifier. The integration is computed in software, rather than in hardware. The hardware integrator is fixed at about 0.5sec, with samples being taken at 5Hz."
VE3MDL image
thumbnail

Peter Cheasley, VE2TPR, detected this narrow-band signal component, standing out clearly against the background noise, on 3500 MHz, from RA 23:58:46, Dec 44d 05m N, at 0113 UTC on 8 November 2003. The spectral display is exactly what we would expect from an unmodulated carrier such as might be emitted by an interstellar beacon. Unfortunately, without independent corroboration or a repeat of the signal, further analysis is not possible, and we can only speculate as to the signal's true origin.
VE2TPR image
thumbnail

SETI League regional coordinator Christian Monstein, HB9SCT, captured this magnificent long-duration solar flare on 28 October 2003, from his home in Freienbach, Switzerland (JN47je). He used the CALLISTO spectrometer sweeping 42 to 865 MHz at 300 kHz bandwidth, driven by a fixed-mounted log-periodic antenna pointed at zero degrees declination. Christian writes, "In the last few days I really got very impressive results, although the antenna was never pointing directly to the sun."
HB9SCT image
thumbnail

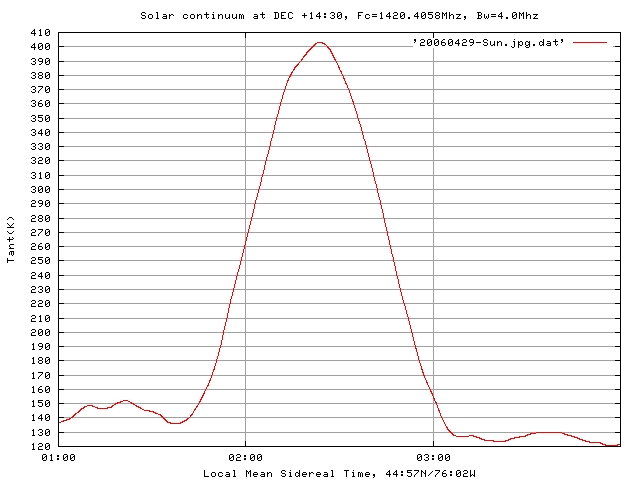
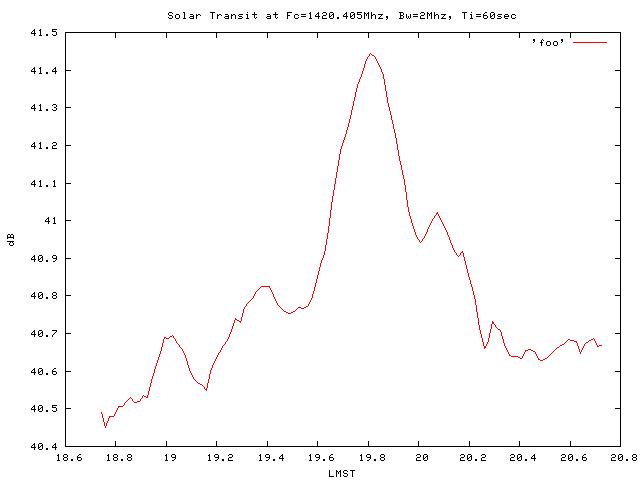
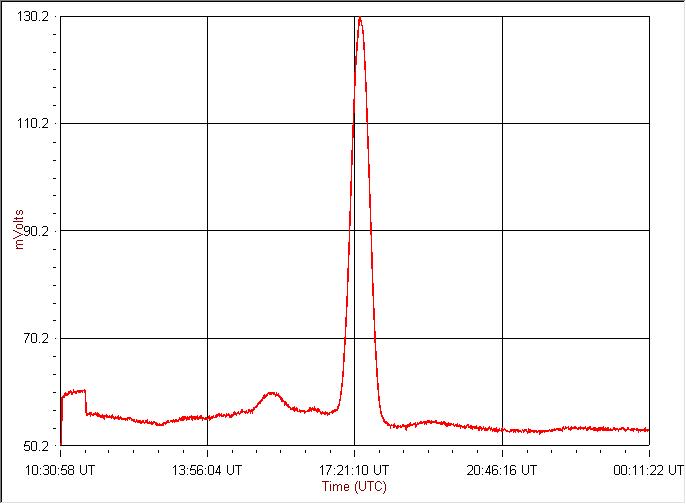
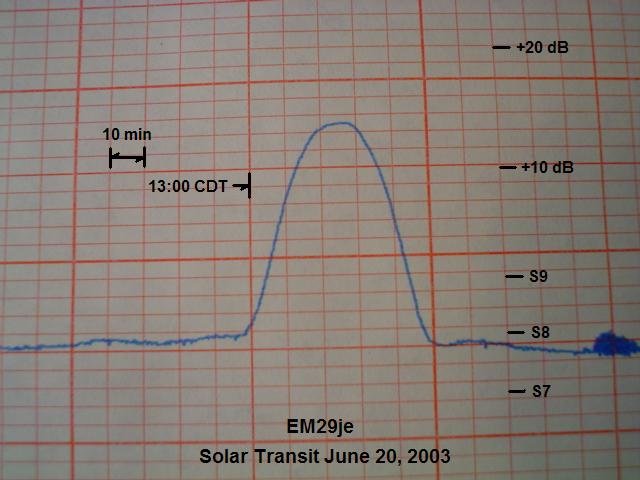
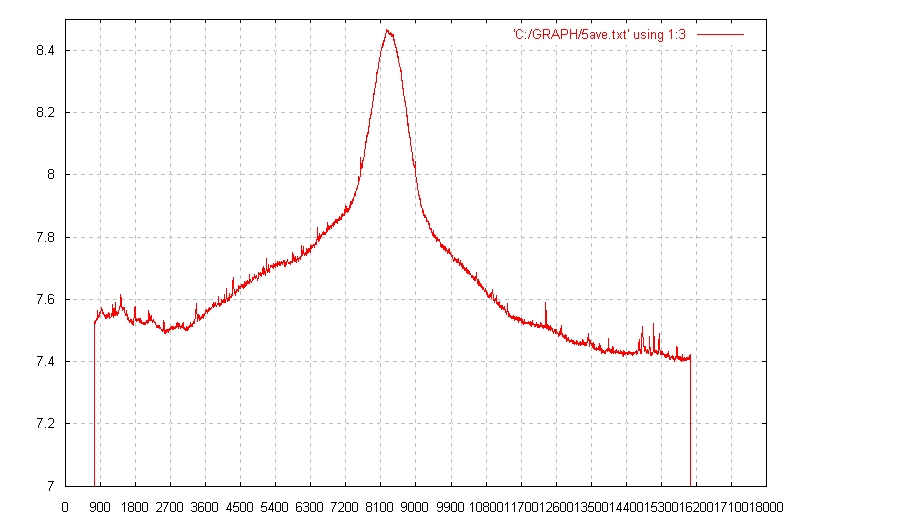
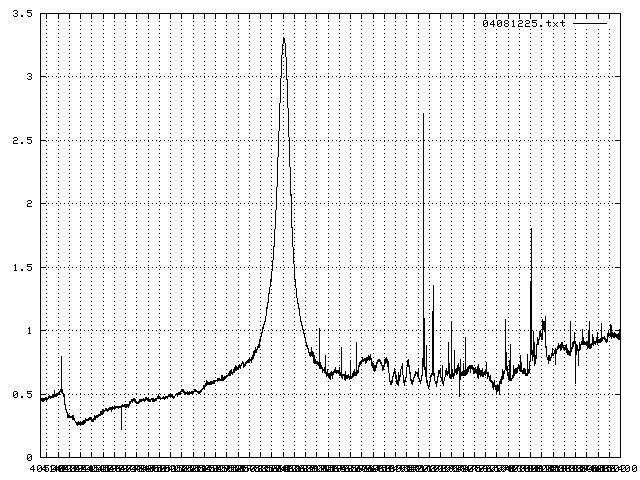
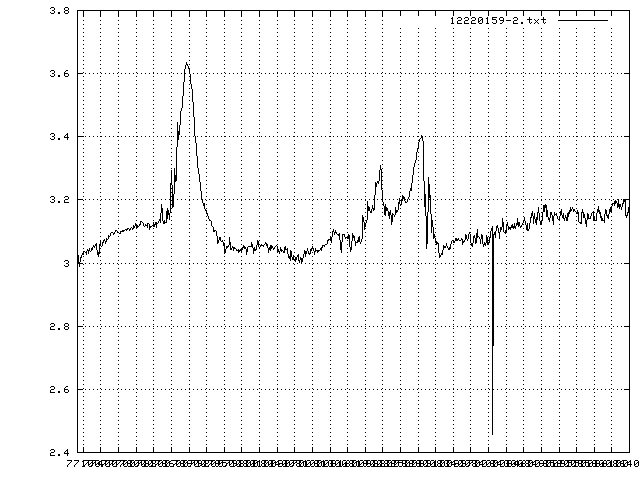
Harry Kimball, N0TOU, recorded his first sun transit at Argus station EM29je on 20 June 2003, on a strip-chart recorder driven by a 3-meter dish, RAS cylindrical feedhorn with choke ring, RAS LNA, DEM downconverter, and Kenwood TS-700A ham transceiver. Harry writes: "The input to the chart recorder is connected across the S-meter on the Kenwood via a voltage divider (to get the ~200 mV max signal down within the 10mV range of the chart recorder; and I threw in a capacitor to give it about a 3 or 4 second time constant). I started it up in the morning before I went to work and found this peak when I got home. According to Starry Night software, the sun should have transited my location at about 1:22 PM CDT. In this recording it looks like I saw the sun go by at about 1:24, which would mean my dish azimuth is actually about 181.5 degrees rather than 180. I don't know how close my elevation setting is, but it looks like it can't be off too many degrees. I marked the chart levels corresponding to several S-meter readings on the picture. Assuming the 6 dB per S-unit rule of thumb, the peak is nearly 20 dB above the baseline. I don't know how accurate this is or what I should expect to see, but the signal to noise ratio makes me think that I'm off to a fairly good start."
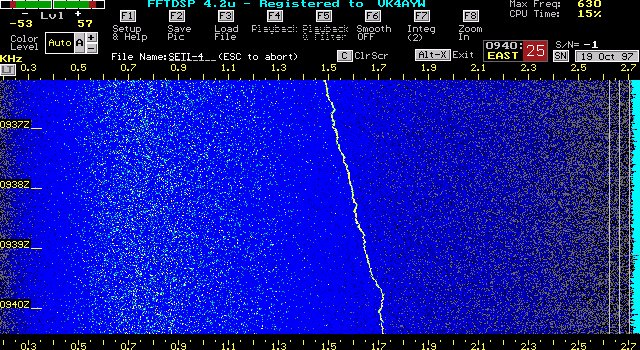
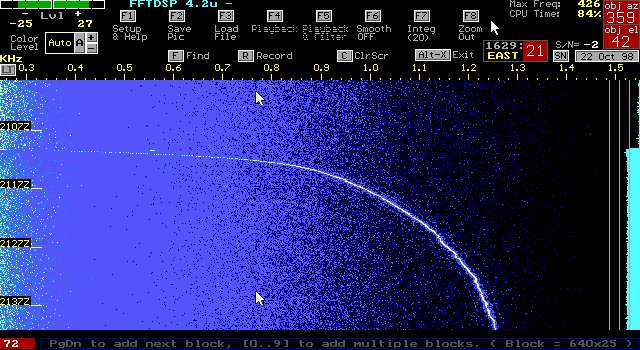
N0TOU image
thumbnail

David Ocame, N1YVV, achieved first light at Argus station FN31ng on 29 May, 2003. Here (peaking at 21:34 LMST) is his first transit of the Sun, captured with Radio Skypipe software. His station uses an eight-foot parabolic dish, homebrew dipole feed, and Down East Microwave PHEMT LNA driving an Icom receiver.
N1YVV image
thumbnail

Jim Van Prooyen, N8PQK, made this drift-scan observation at 406.7 MHz with a 75 kHz bandwidth, from RA 2h 43', DEC N 3 Deg 7', near the star Gamma Ceti. The units on the Y-axis are in VOLTS, and the units on the x-axis are samples from the start of the file. There are 20 seconds between data points. Jim has never seen any (useful) data from this part of the sky before. He concludes, "This could be a man made source. A carrier wave from a low earth orbiting spacecraft is the likely source I can think of, or some type of star flare."
N8PQK image
thumbnail

Project Argus collaboration in action

Tom Hutter writes: "I see this ladder effect occasionally at 1575.42 Mhz, and have pinned it down to GPS-BIIA-18. Has any of you ever seen the pattern, or can anyone offer reason for the effect?"
Richard Tyndall replies: "It looks very similar to the GPS modulation pattern that I saw on my very first false alarm years ago. The main difference that I see on Tom Hutter's image is the lack of heavy Doppler that would normally be seen on a GPS bird."
Marko Cebokli adds: "The C/A code length is around 1ms, therefore spectral components spaced 1kHz (the left one at 500Hz looks different because of stretched frequency scale). The width of the lines matches quite well the 50bps data modulation. So I guess in this case there were strings of zeros or ones in the data."

Tom Hutter image
thumbnail

Rodney Howe received this strange intermittent pattern on 1420 MHz, eight repeating cycles with a little 'scruff' after the 4th group of 8 cycles, each burst about 8/10 of a second long. He solved the mystery: "I run the SETI@home screen saver on my Macintosh G4, which is east of my 8' dish. It turns out that the signals I recorded are the emissions coming from the SETI@home screen saver. I puzzled over this signal as it did not repeat at the same time every day. But, when I left the Mac on and went to watch the scope, there it was. I've started and stopped the screen saver many times. And it is always the same; when the screen saver goes on I get the signal on the scope. As you can imagine, I thought I had found ET!"
Rodney Howe image
thumbnail

Peter Cheasley, VE2TPR, displays time-domain signals using Acon Acoustica. He writes: "It transfers from there to the Spectogram spectrum analyzer program and saves as a .WAV file. This is what I use to bring .WAV files into and for the immediate analysis. Then on to the conversion. I get a lot of data really fast. Also, unlike SETIFox, which requires 3 wav files to get minimal data to convert, this goes to about 9 minutes of recording."
VE2TPR image
thumbnail

From New Zealand, Graham Vincent reports:
"I am seeing a signal at about 1420.475 MHz that comes and goes on an irregular basis. It doesn't matter where I point the dish so I'm picking it as either external interference from a terrestrial source or signs of trouble with my equipment. On the positive side the other brighter zones are in Sagittarius so I think I've discovered the milky way!"
Graham Vincent image
thumbnail

While searching for our W2ETI moonbounce beacon signal on 1296.000 MHz, Argonaut Tom Hutter (station FN20ut) stumbled across this Frequency Shift Keyed signal on 1296.007 MHz. Though certainly of terrestrial origin (it remained in the beam of his drift-scan antenna as the Earth continued to turn), it was his first detection of digital modulation in the 23 cm ham band.
Tom Hutter image
thumbnail

At Project Argus station FN35dm, Peter Cheasley, VE2TPR, analyses the audio output of his receiver with a music program. See his Software Notes here.
VE2TPR image
thumbnail

From the University of Indianapolis, Malcolm Mallette writes:
"Here is the plane of the galaxy at the declination of 3C392, which is about +1.4 degrees. The graph is an average of 5 observations, each separately temperature corrected. I was hoping to see 3C353, which is 1 hour 36 minutes earlier on that dec. We do have some variation from the baseline at that time but not strong enough to be definitive.
"It looks as if replacing the two line amps at the receiver with the SETI League suggested line amps at the dish does work. The DC gain is set back from 100 to 50. However, the 50 Jansky source did not appear. It is probable that the local interference pervents us from seeing bellow 100 Janskys. 3C392 is around 50 Janskys but it is in the plane of the galaxy that is huge at 1.4 GHz. "
University of Indianapolis image
3C392 at 1420 MHz

From the University of Indianapolis, Malcolm Mallette reports his first observations at 1.4 GHz. The radio telescope had been operated on C-band until recently. First light on the neutral hydrogen line occurred at 1000 UTC on 9 April 2001, with detection of Sagitarius A. The radio astronomy program at the University of Indianapolis has claimed the very first ETCC Certificate, with a fifteen source endorsement.
University of Indianapolis image
SagA at 1420 MHz

SETI League software committee chairman Daniel Fox writes, "Recently I modified my dish positioner and software to track the galactic plane as the Earth rotates. This plot shows how the hydrogen line emissions from several arms of the Galaxy are Doppler shifted in different directions. There is also a noticeable Doppler shift imposed by the motion of the Earth around the Sun. I was given a copy of the Dwingeloo neutral hydrogen survey, and was able to extract the data for the galactic plane and plot it so I could compare it with my data. I was quite pleased with how well the two matched."
KF9ET image
KF9ET Milky Way map

While doing meridian transit sweeps at Declination -14, Argus station FN42jl saw this intense hydrogen emission from the galactic center. Rich Tyndall reports, "It looks like a really bright spot out there. I have not done 'Scanner' passes in the early AM. So, I've not seen this pattern before."
NJ1A image
 NJ1A image

Argus station FN42jl captured this nice example of interstellar hydrogen radiaton at RA 09:04:27, Dec -14:11:03. Rich Tyndall writes: "I started off with a fat double peak that thinned out and faded away. But later, I looked over at the tube and saw the thin white line. It didn't look too bright, but it was real narrow. When I looked down at the spectrum display, I said, 'Wow! That's a major Hydrogen Peak!' Did a save and watched it drift up slowly for a while longer. It's about 20% higher than I normally see (or notice). Set up for 150 steps of 10 kHz each. (1.5 MHz wide)."
NJ1A image
 NJ1A image

CW signal from a weak signal source used to test the hydrogen line receiver at Argus station FN11LH. This signal was below the observer's audible threshold in a 2.4 kHz SSB bandwidth, and is discernible only through long software integration. Tiled Spectra Plus screen shows time domain, frequency domain, waterfall and surface plots simultaneously.
N6TX image
 N6TX image

No discernible pattern is found in this plot of random noise at the netural Hydrogen line (1420.40575 MHz), as observed at Argus station FN11LH. Tiled Spectra Plus screen shows time domain, frequency domain, waterfall and surface plots simultaneously.
N6TX image
 N6TX image

Software Committee chairman Dan Fox spent several months trying to figure out these occasional bursts of broadband interference. They are especially perplexing because they tend to rise and fall in amplitude in a manner consistent with an extraterrestrial source. In fact, Dan is now convinced he's seeing an intermittent gain variation in his Icom 7100 receiver, due to thermal instability. Such equipment malfunctions masquerading as signals underscore the importance of independent confirmation of all SETI candidates.
KF9ET image
thumbnail

Christian Monstein, our Regional Coordinator for Switzerland, caught the solar flare of 17 November 1999 on the Ricken-Sued ten meter radio telescope, at 210 MHz.
HB9SCT image
210 MHz solar flare

Member Malcolm Mallette is running a 4 GHz total-power radio telescope at the University of Indianapolis. In this plot (seen in full by clicking on the thumbnail) can be seen peaks corresponding to a meridian transit of Taurus A, 3C157, and the full moon, respectively.
University of Indianapolis image
 4 GHz total-power signals

speaker Click on the speaker icon to hear the background noise of the cosmos, recorded on the 1420.40575 MHz neutral hydrogen line by one of our Project Argus radio telescopes. The Spectra Plus image at right shows no pattern whatever in the cosmic noise.
(108 kByte WAV file; 5 seconds)
SETI League image
N6TX H1 signal

Radiating a stable test carrier from a laboratory signal generator toward the antenna while recovering hydrogen line radiation as above, we now see a thin, straight vertical line clearly visible against the background noise. This, we believe, is how our first evidence of extra-terrestrial intelligence will manifest itself. Note that the test signal is far below the threshold of audible human detection, yet easily discerned by our digital signal processing software.
SETI League image
 N6TX test signal

Member Gerry Cavan is receiving interference from air traffic control radar at 1339.4 MHz, even off the back of his 10 foot diameter dish at Argus station EN92UX. The pulsed signals are quite loud, and extremely broadband, but are unlikely to be mistaken for intelligent signals of extra-terrestrial origin.
VE3EYR image
 VE3EYR radar signal

In late October of 1998 these images of a claimed SETI hit, allegedly received on a 10 meter dish from the direction of the EQ Pegasi binary star system, were posted to our closed signal verification email list by an anonymous hacker. 63 Project Argus participants, plus three professional radio astronomy facilities, wasted three weeks trying to verify what proved to be a blatant hoax. As a result, it is now the policy of The SETI League not to respond to anonymous posts. In addition, we will no longer expend time or resources analyzing reports which have not adhered to our Project Argus Detection Protocols.
anon1420 images
hoax signal 19981023

hoax signal 19981022

Noel C. Welstead, SETI League volunteer coordinator for Eastern Australia, has spent the past year chasing down computer-generated interference. Of this first of three images, he says, "We got the first one and noticed it by accident. It has a nice even shift in frequency and looked like a classic signal from a space borne source. It was weak to start with and got stronger as time went by. I started a screen save and the system crashed immediately after saving the file."
VK4AYW image
 VK4AYW Signal 5

Second of three computer RFI images recorded by Noel C. Welstead. He writes, "By the time I had restarted the system the signal had moved into the middle of the H1 line frequency. The receiver was tuned to 1420.404.50 so the H1 line was at 1.25khz on the FFTDSP display. The signal started to show a slight curve indicating that it was starting to pass overhead???"
VK4AYW image
 VK4AYW Signal 4

Third in a group of three images observed by Noel C. Welstead. "I have been caught before so I went looking for some sources of RFI just to be sure. I turned the PII/266 system on the workbench off. Voila, the signal dissappeared! I waited for a short time and switched the system on again. The signal re-appeared. This series was especially interesting as it was a very stable drift, No wiggling at all. A very exiting time for about 5 minutes."
VK4AYW image
 VK4AYW Signal 3

Daniel Fox, SETI League software committee chairman, has been experimenting with Doppler mapping of the Milky Way. The frequency of hydrogen line radiation, like that of all interstellar signals, is Doppler shifted by relative motion. This drift-scan graph displays time horizontally, frequency vertically, and signal intensity by colors. It shows the rate at which hydrogen sources at the galactic center are moving toward and away from us.

SETIFox data file graphed in Microsoft Excel®

KF9ET image
KF9ET Milky Way map

Graham Vincent, SETI League volunteer coordinator for New Zealand, received this intriguing signal on 2 August 1998, at a frequency of 1281.919 MHz USB (in the 23 cm amateur radio band). The appearance of the signal is similar to a class of anomalies detected by the SETI Institute's Project Phoenix targeted search. Dubbed "wigglers" by the SETI Institute's Dr. Jill Tarter, their detections have always proved to be cases of radio frequency interference. Graham's signal is no exception. It turned out to be computer rfi, generated within the very computer which he was using to run his signal analysis software. England co-coordinator Ken Chattenton, who has had similar experiences, recommends that if a signal is strong enough to be audible, one should turn off the computer and see if it goes away.
GPV Enterprises image
 Graham Vincent wiggler signal

As Gerry Cavan, VE3EYR, describes this signal: "The bottom is a hit first detected by SETIFOX on 1420.477 MHz, and repeated every day at the same RA 9:36:40 DEC 3:33:52 from this location EN92ux. The interesting thing about this hit is the fact that it displays none of the modulation I normally get from GPS qrm and that the doppler is reversed. The top of the display is the GPS signal as received on 1575.4 MHz usb, after about one minute of this I switch back to the hit at 1420.477 to analyze the signal. The GPS signal gets up to S9+ on the R-7000 for the same time as the hit approx. 18 minutes, at this time the display goes back to just noise. I think the hit is caused by the strong GPS signal beating with some local signal (intermodulation)."
VE3EYR image
 VE3EYR GPS signal

Noel C. Welstead, SETI League volunteer coordinator for Eastern Australia, received these anomalous signals on 19 October 1997, 0727 UTC, at his location in Brisbane. In his words, "Had my first real workout on the R.T today. We got a hit on 1418.13550 MHz and watched it for awhile. You can see the drift in frequency, and also what appears to be some sort of modulation. The really strange thing is that during the time we watched the signal it drifted up the band, stabilized and then drifted down again. OK, so It's a satellite in a geo-stationary orbit (more or less), but why did the signal drift up, then down? The signal was definately coming down the co-ax and not from inside the shack. I turned off the power to the LNA to check."
VK4AYW image
 VK4AYW Signal 2

Another view of Noel C. Welstead's interfering signal of 19 October 1997. The following day he noted, "The signal is still there so it's not ETI. The receiver was on for several hours and quite stable (ICR-8500). My dish is pointed straight up and I am located at 153 deg east 27.25 deg south." This would equate to a declination of -27.25 degrees, but the right ascention is varying over time, which entirely rules out the possibility that the signal emanates from an extra-terrestrial source.
VK4AYW image
 VK4AYW Signal 3

Third in a series of three images from Noel Welstead, which are looking increasingly like terrestrial interference from a free-running (instable) oscillator of some sort. He says, "Interesting to note the slight frequency drift on the trace. This does not happen on other signals we have seen. Must be some sort of drift due to equipment instability as well as Doppler. We are still in test mode here as we still have not worked out the scanning/detecting and notification method yet."
VK4AYW image
 VK4AYW Signal 4

Global Positioning Satellite interference on 1575.7820 MHz USB, detected by SETI League member Ian Drummond, VE6IXD, on 21 June 1997. Ian says, "I assume it is a navigation signal and not the one we have been waiting for!" The Doppler pattern evident in this image is characteristic of mid-orbit satellites. The appearance of this signal should help to dispel the myth that pseudo-random-noise coded spread-spectrum signals are indistinguishable from the background noise! In fact, though difficult to decode without the proper key, the presence of these signals is quite evident. Should other civilizations be using spread spectrum communications, our chances of detecting them are not necessarily diminished.
VE6IXD image
VE6IXD GPS signal

On 24 July 1997, Ian Drummond also attempted (unsuccessfully) to detect neutral hydrogen radiation from interstellar space. Ian says, "This image was taken while my receiver was sitting on 1420.4047 MHz USB. That is to say the hydrogen line (un-Doppler shifted) would appear at 1.05 kHz in this output. As you will see there is no sign of such a narrow line. The colours (stronger signal) at the higher frequencies are an artifact of my system, possibly caused by a non-flat audio band pass of the ICOM radio. When I first turn my system on the noise is centred at about 1.2kHz what ever frequency the radio is tuned to, and it shifts over several hours to the pattern you see in the gif file."
VE6IXD image
VE6IXD H1 signal

Anomalous signal detected by SETI League member Dan Fox on 1 December 1996, while preparing to scan the Crab Nebula just below the hydrogen line frequency. This signal could well be satellite or terrestrial interference, or equipment malfunction. It could just as easily be an astrophysical phenomenon. Without follow-up detection, we'll never know. This experience underscores the importance of pairing up our sky survey participants for instantaneous signal verification. See the related editorial.
KF9ET image
KF9ET unknown signal

This CW signal from the Mars Global Surveyor was received by SETI League member Mike Cook on 25 November 1996, while the spacecraft was about 5 million km from Earth. The satellite's 1.3 Watt beacon transmitter, into an omnidirectional antenna, provided SETI enthusiasts with an excellent dry run to verify the operation of their receivers and digital signal processing software. Several other SETI League members were also able to recover the signal utilizing Mike's FFTDSP shareware program. See Mike's article for further details.
AF9Y image
AF9Y MGS signal

speakerAnomalous signal detected by SETI League member Trevor Unsworth on 10 May 1996, at 1471.5 MHz, using a surplus 3.5 meter dish. The signal exhibited clearly audible digital modulation, with a 270 Hz bandwidth. Its Doppler shift of -25 Hz/min marks it as RFI from a Low Earth Orbit (LEO) satellite. Though clearly not of extra-terrestrial origin, this signal gave Project Argus its first real workout, testing both the sensitivity of our receiving stations, and our ability to recognize terrestrial and satellite interference. See associated editorial.
G0ECP image
G0ECP LEO signal

Though not a SETI League "hit," no discussion of SETI results would be complete without this one. The most famous of all SETI candidate signals (it was even mentioned on The X-Files), the Ohio State University "Wow!" signal was detected on 15 August 1977. Twenty years later, after more than 100 follow-on studies, it remains an intriguing unexplained phenomenon. These articles discuss the signal and its implications to The SETI League's present search. The meaning of the symbols at right is discussed here.
Ohio State University image
Wow! signal

When viewing the "Wow!" signal in its raw data form above, the signal buried in the noise would be evident only to the likes of Jerry Ehman. By graphing the raw data as a time-series, we clearly see the radiation pattern of the antenna, consistent with its beamwidth in drift-scan mode, including the coma sidelobes, and beam squint (asymmetry) caused by slight offset of the feedhorn. This pattern effectively rules out terrestrial, aircraft or spacecraft interference.
SETI League image
Wow! graph

This is not actually a SETI@home detection. Rather, it is a simulation of how the legendary Ohio State University "Wow!" signal of 15 August 1977 would have displayed in the SETI@home software, if it had been received at Arecibo. Clearly, the SETI@home system is capable of detecting the next "Wow!" that comes along.
Bruno Moretti Turri image
 thumbnail

Frank Drake conducted Project Ozma, the world's first modern SETI experiment, from this 85 foot diameter dish at the National Radio Astronomy Observatory, Green Bank WV. On 8 April 1960, he detected a strong periodic pulsed signal while aimed at the nearby sun-like star Epsilon Eridani. The signal at first seemed to exhibit many of the characteristics we would expect of an extra-terrestrial message. When the signal repeated five days later, Dr. Drake tracked it across the sky with a small waveguide horn antenna, and determined it to be interference from a passing high-altitude aircraft. All subsequent SETI experiments have been similarly plagued by false hits.
SETI League photo
Ozma dish

Click here for lots more pictures.


Click to email the Webmaster
email
the
Webmaster
| Home | General | Memb Svcs | Publications | Press | Technical | Internet | Index |
entire website copyright © The SETI League, Inc.; Maintained by Microcomm
this page last updated 22 September 2012
Click for top of page
Top of Page