small logo SETI League Technical Manual -- Software

Graphing the Galaxy
By Daniel B. Fox, KF9ET (foxd @ indiana.edu)

Ever since Grote Reber, W9GFZ, produced the first radio map of the Milky Way galaxy in 1937, amateur radio astronomers have delighted in producing visual depictions of the radiation intercepted by their antennas. Here, for example, is a Doppler Shift plot of interstellar hydrogen from the region of the galactic center:

The frequency of hydrogen line radiation, like that of all interstellar signals, is Doppler shifted by relative motion. This drift-scan graph displays time horizontally, frequency vertically, and signal intensity by colors. It shows the rate at which hydrogen sources at the galactic center are moving toward and away from us.
KF9ET image
Milky Way map

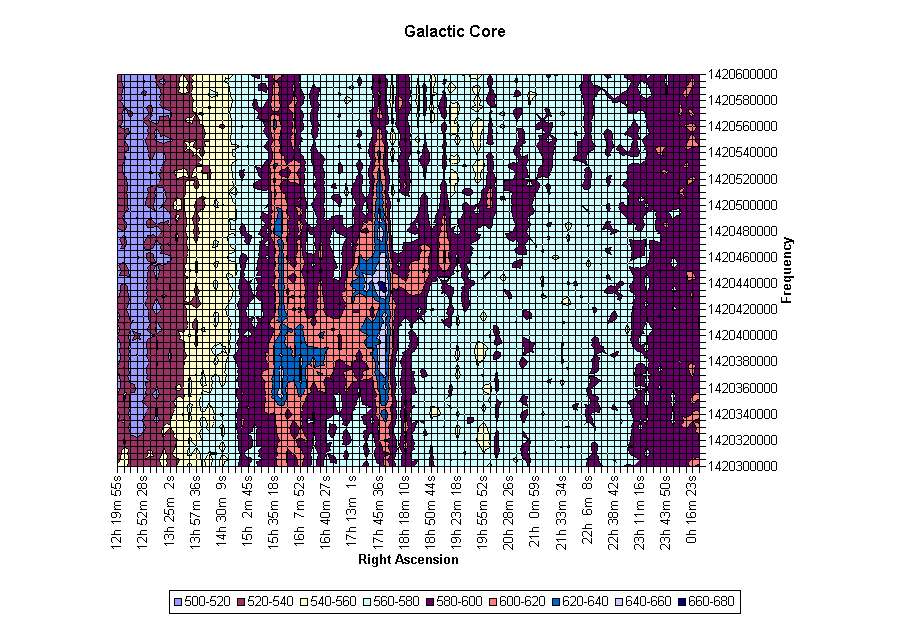
Click for larger image

Plots such as the above can be produced from an amateur SETI station, by reading the raw data from the Digital Signal Processing (DSP) hardware and software into an ASCII file, and then displaying it graphically in a spreadsheet program (such as Microsoft Excel ®).

The following listing is a QBASIC program for taking power information from SETIFOX POWRDATA.TXT files and arranging it into a labelled Right Ascension versus Frequency array that can be imported into a spreadsheet. The program listed below opens a POWRDATA.TXT file located in the SETIFOX directory and saves the converted text to a file called GALAXY17.TXT in the same directory. The saved file will have the columns labelled with the frequency and the rows with the right ascension.

fq$ = ""
l$ = ""
flag = 1
OPEN "C:\SETIFOX\POWRDATA.TXT" FOR INPUT AS #1
OPEN "C:\SETIFOX\galaxy17.TXT" FOR OUTPUT AS #2
WHILE (NOT EOF(1))
INPUT #1, a$
INPUT #1, b$
fr$ = MID$(b$, 7, 10)
p$ = MID$(b$, 45, 10)
ra$ = MID$(a$, 67, 12)
IF fr$ = fq$ THEN
IF flag = 1 THEN PRINT #2, f$: flag = 0
PRINT #2, l$
f$ = ""
END IF
IF fq$ = "" THEN fq$ = fr$: f$ = SPACE$(11)
IF fr$ = fq$ THEN l$ = ra$ + " " + p$: f$ = f$ + " " + fr$
IF fr$ <> fq$ THEN l$ = l$ + " " + p$: f$ = f$ + " " + fr$
WEND
PRINT #2, l$
CLOSE #2
CLOSE #1
END

In EXCEL97 rather nice surface or 3D graphs can be made by the following method:

  1. Click on File>Open and select 'Files of Type' Text Files.
  2. Select the output file from the above program (in this case GALAXY17.TXT).
  3. Click the Open button.
  4. You will now be in the Import Text Wizard Click the Next button.
  5. Double click on the two lines breaking up the Right Ascension column. This should delete them.
  6. Click on the Next button then the Finish button.
  7. The text is now imported to EXCEL.
  8. Click on Insert>Chart to start the Chart Wizard.
  9. Select 'Chart type' surface and the Chart sub-type you want.
  10. Click the Next button.
  11. Step two of the Chart Wizard will show the data range. The series should be in columns.
  12. If necessary, you can edit the last number in the Data Range to remove an incomplete sweep of frequencies.
  13. Click the Next button.
  14. Fill in Chart Title and labels for X,Y and Z axis as appropriate. Select chart options.
  15. Normally, I label the X axis Right Ascension and Y axis Frequency. If doing a 3D plot I label the Z axis power and show major grid lines. The legend I show at the bottom of the plot.
  16. Click the Next button.
  17. Select 'New Sheet' or 'Object'. I normally select 'New Sheet'.
  18. Click the Next button.
You now have a plot in EXCEL97 which can be rotated and rescaled to bring out features in your scan.


Click to email the Webmaster
email
the
Webmaster
| Home | General | Memb Svcs | Publications | Press | Technical | Internet | Index |
entire website copyright © The SETI League, Inc.
this page last updated 23 November 2002
Click for top of page
Top of Page